Table of Contents
ToggleUnderstanding ESXi PSOD and Troubleshooting them
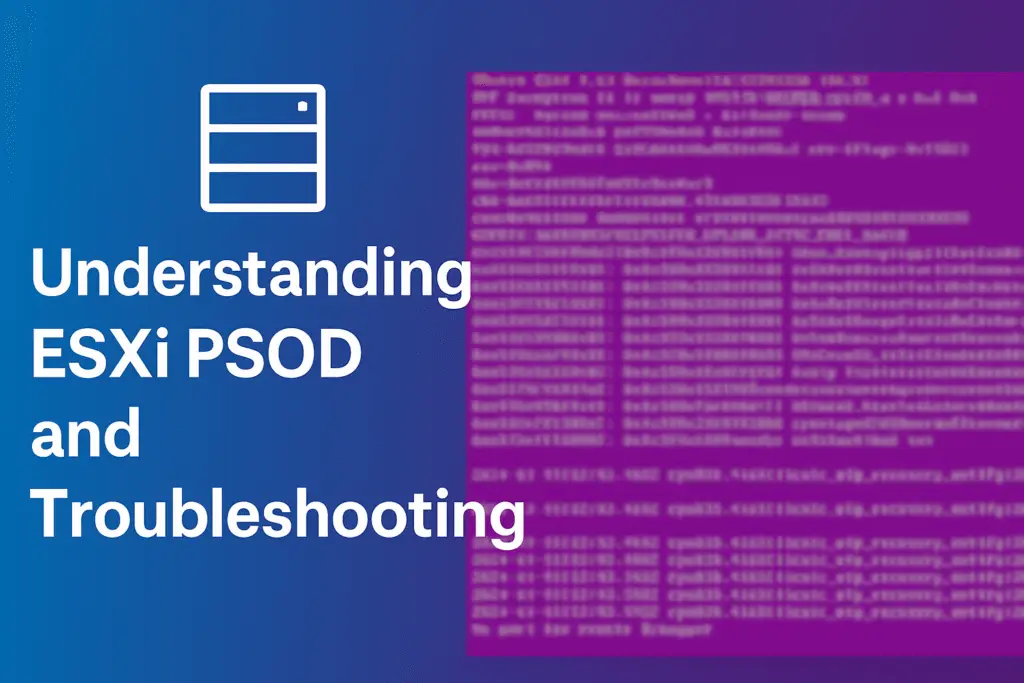
In this article, we will explore what is ESXi PSOD , understanding ESXi PSOD, its causes, and how to troubleshoot and resolve it step-by-step. Whether you’re a beginner or an experienced VMware administrator, this guide will help maintain a more resilient and stable infrastructure.
What is ESXi PSOD?
The Purple Screen of Death (PSOD) is a critical error displayed by an ESXi host when VMware hypervisor encounters a fatal condition it cannot recover from. This typically indicates kernel panics, hardware failures, or unsupported components.
Typical error messages may include
- “PCPU x locked up. Failed to heartbeat.”
- “#PF Exception 14 in world…”
- “LINT1-NMI: Unexpected NMI received.”
Common Causes of ESXi PSOD
Several underlying issues can cause a PSOD. Identifying the source is critical to resolving the problem and preventing recurrence.
- Hardware failures – faulty RAM, CPU, or storage controllers
- Outdated or unsupported drivers (especially RAID or NIC drivers)
- Firmware mismatches or incompatibility
- Unsupported or non-validated hardware
- Resource overcommitment or contention
- Third-party unsupported VIBs (VMware Installation Bundles)
When a host experiences PSOD:
- Virtual Machines (VMs) running on the host crash or become unreachable if they isolated to restart on next available ESXi Hosts
- High Availability (HA) may restart VMs, causing service interruptions
- Performance across the cluster may degrade during failover
This makes it essential to quickly diagnose and mitigate PSOD incidents in vSphere environment.
Step-by-Step Troubleshoot ESXi PSOD
1. Capture the Error Screen
Before rebooting the host, take a screenshot or photo of the purple screen. Pay attention to:
- Exception type and CPU registers
- PCIP ID and backtrace output
- VMkernel version and build number
Note: You can configure remote logging or serial redirection to automatically capture PSODs in headless environments.
2. Collect Core Dump Files
Core dumps contain the memory state of the system at the time of the crash, essential for in-depth analysis.
To verify if core dumps are configured:
esxcli system coredump partition getEnsure the core dump location is active and writable. Dumps are typically located in /var/core/.
3. Analyze Log Files
Investigate relevant system logs to pinpoint the issue:
/var/log/vmkernel.log– Kernel and hardware events/var/log/vmkwarning.log,hostd.log– Warnings and service-level logs/var/core/– Crash dumps for forensic review
Example : This is example PSOD hit in couple of esxi hosts in our environment and by analyzing Core Dump and vmkernel logs, the cause of PSOD identified due to the SMX-provider encountered an “out of memory” error, and the sfcb-smx process attempted to access a thread in an unexpected manner and QLogic qfle3 native driver and firmware were outdated as in following screenshot.
PSOD on screen codes and core dump provides clear visibility on what causing the PSOD in ESXi Host, like : different ESXi Host core dump logs are showing following error
Decoded Core Dump Log analysis for the above error in the screenshot:
2025-01-17T03:22:18.252Z cpu3:2109400)@BlueScreen: Machine Check Exception on PCPU3 in world 2109400:vmm0:esxi02
Time: 2025-01-17T03:22:18.252Z – Timestamp of when the PSOD occurred.
CPU: cpu3 – The error happened on physical CPU core number 3.
World 2109400:vmm0:VM – The error occurred in a world belonging to the virtual machine monitor (vmm0) for a virtual machine.
Error: Machine Check Exception – indicating a hardware error detected by the CPU. “System has encountered a Hardware Error – Please contact the hardware vendor” – This is a clear indication that need to investigate hardware issues.
2025-01-17T03:22:18.267Z cpu3:2109400)Code start: 0x42000aa00000 VMK uptime: 72:08:07:24.171
Code start: 0x42000aa00000 – Address in memory where the VMkernel code begins.
VMK uptime: 72:08:07:24.171 – The ESXi host had been running for approx. 72 days, 8 hours, 7 minutes, before the error.
2025-01-17T03:22:18.290Z cpu3:2109400)0x45392fc9beb0:[0x42000ab5343e]IDTVMMMCE@vmkernel#nover+0x12 stack: 0xffffffffffffffff
Stack Address: 0x45392fc9beb0 – Address in memory of a point within the call stack.
It would be Best Practice to use tools like VMware Log Insight or vRealize Operations to centralize and correlate logs for faster diagnosis.
4. Validate Hardware Compatibility
Use Broadcom Hardware Compatibility Guide (HCL) to ensure your server components are certified for the ESXi version in use.
5. Update Firmware and Drivers
Mismatched firmware and driver versions are one of the leading cause of PSOD events. Align them using tools like:
- Vendor tools (HPE SUM, Dell Repository Manager)
- vSphere Lifecycle Manager (vLCM)
- Manual offline bundles via SSH
esxcli hardware pci listUse the above command via SSH or ESXi Shell to check driver/firmware versions and update accordingly.
6. Monitor Host Health and Sensors
Check for overheating, power supply issues, or fan failures.
esxcli hardware ipmi sensor getNote: If you receive “not recognizing” error , it means IPMI Support is not available , usually it only available if the host hardware and drivers support IPMI (Intelligent Platform Management Interface). On some systems or vendors (like HP, Dell, or Cisco), IPMI tools may be missing or replaced with proprietary tools (e.g., hponcfg for HPE, racadm for Dell)
Alternatively it can be check via: vsphere client > Impacted Host > Monitor > Hardware Health
Example:
If you manage hardware via vendor hardware management tools like iLO for HPE, iDRAC for Dell or CIMC for Cisco, you can check ESXi host hardware status from there.
7. Remove Unsupported VIBs
List installed VIBs:
esxcli software vib listRemove non-VMware or third-party VIBs:
esxcli software vib remove -n vib-name8. Apply ESXi Patches and Updates
Regularly apply critical updates from VMware to address known bugs and kernel issues using vSphere Lifecycle Manager (vLCM) or Offline bundle upgrade via CLI
9. Engage Broadcom Support (Optional)
If you unable to identify issue, generate a full support bundle using following command and raise ticket with Broadcom Support.
vm-supportSubmit logs, core dumps, and screenshots via Broadcom support for expert analysis.
Preventing Future ESXi PSOD Events
- Enable proactive alerts and monitoring in vCenter
- Schedule regular firmware and driver reviews
- Use certified hardware and supported drivers only
- Remove deprecated or third-party VIBs
- Design clusters with HA for fault tolerance
Key Takeaways
- ESXi PSOD is a critical error caused by kernel or hardware faults
- Accurate diagnosis involves log review, hardware validation, and dump analysis
- Firmware, driver, and VIB management are crucial for system health
- Use proactive monitoring and lifecycle updates to prevent recurrence
Frequently Asked Questions
Q1: Can I recover data after a PSOD?
Yes, virtual machines remain intact in most cases. After host reboot, VMs can be powered back on or failed over using HA.
Q2: Can third-party VIBs cause PSOD?
Yes, unsupported kernel modules are a common cause of PSOD and should be removed or replaced with certified alternatives.
Q3: Is PSOD always hardware-related?
No, software bugs, driver mismatches, and VIB conflicts can also trigger PSOD events.
Conclusion
Encountering an ESXi PSOD may seem daunting, but with a structured troubleshooting process, you can identify the cause and implement a lasting fix. Follow the recommendations above to improve resilience, reduce downtime, and protect your virtual infrastructure.
Explore More Related Articles on vlookuphub .


